Supply & Demand: How Does It Work?
Simply Explaining Complex Market Dynamics
Jun 19, 2024
Hello!
Welcome to the Insights, Innovation, and Economics blog. If you’re new here, feel free to read my general Introduction to the Blog to understand more about the blog. If you’re returning, thank you, and hope you have a great read!
Thesis: Supply and demand are the backbone of our capitalist society. Yet, most people don’t know how these factors work, and even fewer people know how to use them to their advantage as consumers, employees, or business owners.
If you haven’t read my Economics Primer, I’d highly recommend it before reading this article as some of the terminology associated with this subject may be difficult to understand.
Credit Vecteezy
Supply
Supply is the amount of a resource that firms, producers, laborers, or other economic agents are willing and able to provide to a marketplace.
That’s a super complicated definition, so I’ll try to break it down in a simple example.
Say, for instance, you live in a tiny town of 100 people and you run the only snow cone shack in the town. In this scenario, you would be the only supplier in the market, meaning you were able to determine exactly how much you wanted to produce and at what time and where.
But, how do you know how much you want to produce?
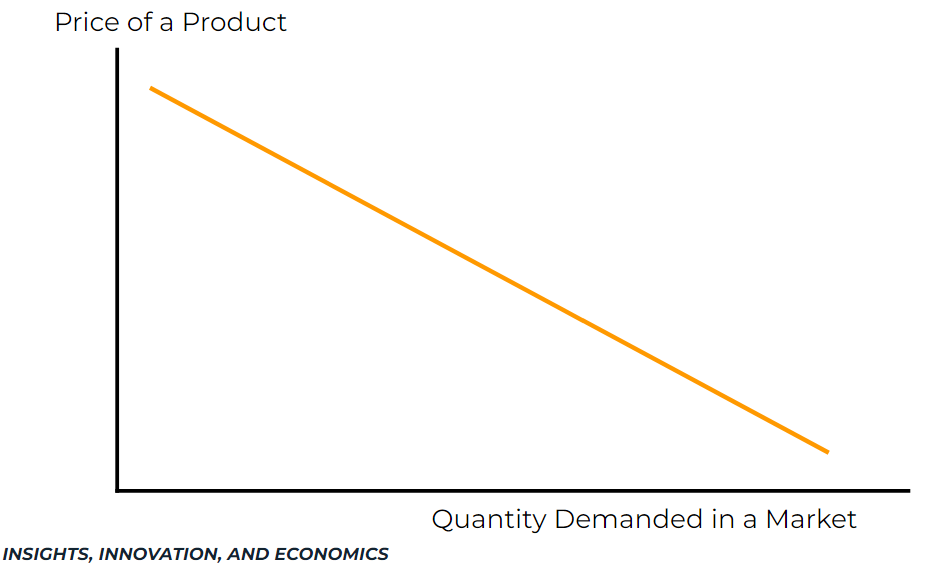
Well, you would want to figure out your supply curve, an example shown below:
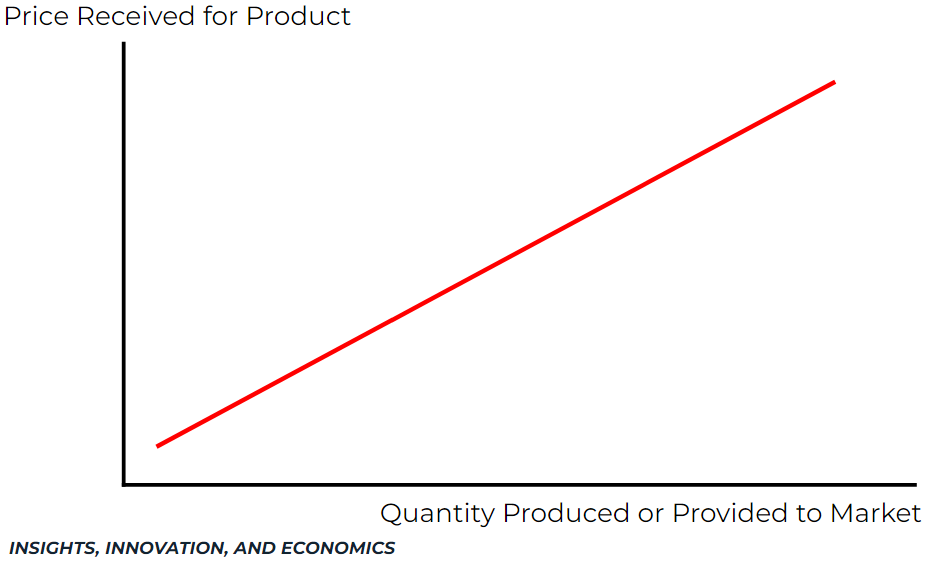
It looks more complicated than it is as the axes are mixed up (welcome to economics). Simply put, as the price of your product increases, the amount or quantity you want to produce increases. In other words, as the price of your product increases, you’re incentivized to produce more and make more money.
Let’s make it a little more complicated. Say, for instance, that you are instead an owner of a pizza franchise in a large metropolitan city. How does supply work now?
Well, actually it works in pretty much the same way. In a market where there is more than 1 supplier, each supplier has their own supply curve. You have one, the restaurant down the street has one, the burger chain across the way has one, etc.
If you combine all of these curves, you create a market-wide supply curve. An example is shown below:
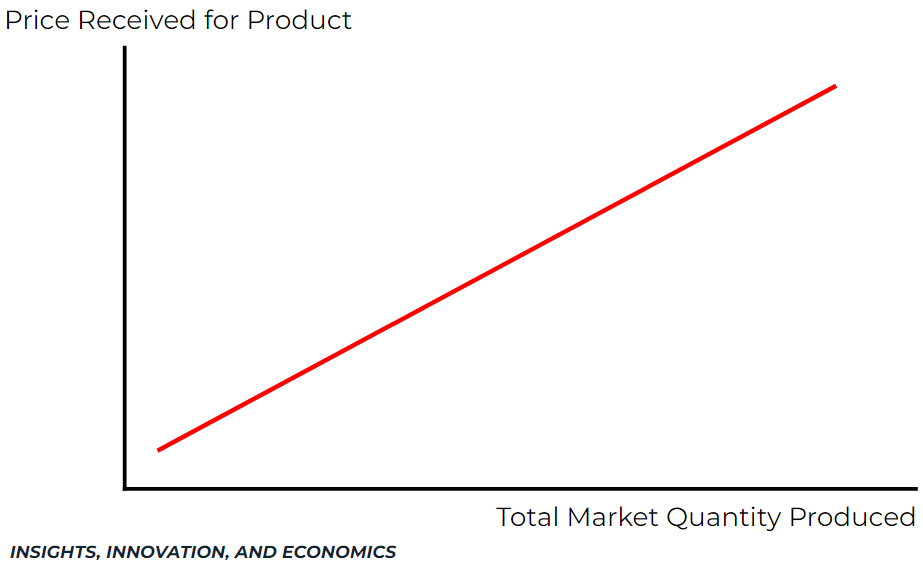
Really the only material difference between the two is that in the individual supply curve, the x-axis is the quantity that a firm specifically produces. In the market supply curve, the x-axis is the total market quantity produced by all of the firms in the market. In both scenarios, the price (on the y-axis) is the same.
So, back to our scenario, you could produce 10 pizzas a day which is ideal according to your individual supply curve (where the price in the market meets your quantity), as shown below:
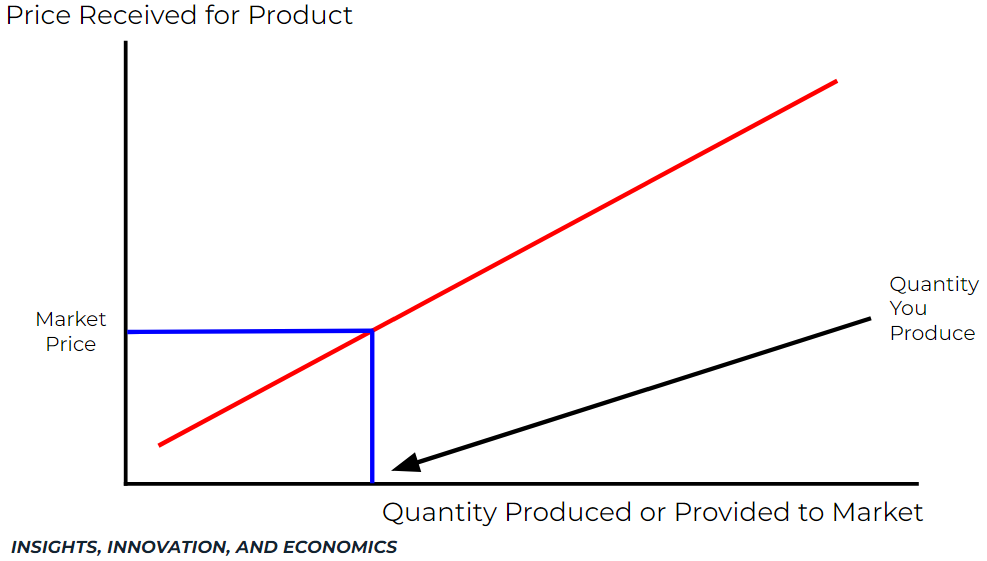
So, you produce 10 pizzas, and the other 5 pizza chains in the area all produce 10 pizzas, meaning the total market quantity is 60 pizzas.
Let’s make it a little more complicated.
A market supply curve is only a snapshot in time, only truly showing what quantity is being produced in that market at that time and at that price. The rest of the curve shows a “best guess” of what would happen if the price increased or decreased.
That’s complicated, so I’ll just rephrase it this way. There are many factors that affect the supply in a market, meaning that they affect either the price in the market or the quantity produced in the market.

Credit MIT Sloan Management Review
Factors Affecting Supply
1. Price: The basic factor affecting supply is the price of the good. If the selling price of the good goes up, the quantity supplied goes up. Conversely, if the selling price of the good goes down, the quantity supplied goes down.
2. Profitability of Alternative Products: If alternative products have more profitability than the current product being produced, suppliers may exit the market in favor of that alternative product. However, this alternative product needs to be close enough to the product already being produced that the costs of switching to it make the enhanced profitability worth it. For instance, if you produce bread, and the wedding cake business starts booming, you may decide to switch to the wedding cake business. This switch would, in turn, reduce the supply in the bread business.
3. Production Conditions: This factor can be obtuse and confusing, so I’ll make it super simple. Usually, production conditions refer to the technology used in production. Technology advances can improve production efficiency, reducing the costs in production. For instance, if a company eliminates 5 manufacturing workers (total cost $500k) by buying an automated manufacturing machine (for $250k) that produces 10 machines per hour instead of the normal 5, the company has reduced its cost by 4 times.
4. Expectations: Sellers’ concerns for the future can directly affect the quantity supplied in the market. If, for instance, a seller believes that future market conditions will involve a decrease in demand, the owner may immediately decrease production efforts because they don’t want excess future supply and costs upfront.
5. Price in Inputs: Also known as the cost of production, the quantity supplied and input costs are directly related. Inputs in this case could refer to raw materials, labor costs, energy, land, etc. When the costs of inputs increase, the quantity supplied decreases as it becomes more expensive to produce each product. However, some firms may choose the opposite strategy, choosing to expand to achieve economies of scale–lower costs through larger quantities.
6. Number of Suppliers: As more suppliers enter the market, the supply curve shifts outwards (there is more quantity supplied in the industry), meaning that prices are driven downwards, restricting further expansion or entrance into the market.
7. Government Policies/Regulations: Governments provide external influences on supply through taxes and tariffs. For instance, let’s say you make diamond rings and the government decides to place a 10% tariff on imported diamonds. This would raise your underlying costs, lowering the quantity supplied. Conversely, a government subsidy would decrease underlying costs, potentially allowing the firm to ramp up production efforts for the same amount of capital input.
8. Supply Chain Disruptions: Throughout the Covid-19 pandemic, we saw the effects of supply chain disruptions. These disruptions cut off critical inputs from being delivered to production companies, reducing quantities able to be supplied.
9. Worker Productivity: If workers’ incentives can be further aligned, furthering worker productivity, significant increases in supply can be realized. Essentially, if workers are more productive, they can increase the quantity possible to be produced.
10. Related Supply: If the supply of related goods increases, input costs will decrease, potentially allowing for an increase in the quantity supplied in the market. For instance, if there is an increase in the supply of chicken meat due to increased demand for chicken sandwiches, there will also be an increase in the supply of feathers.
____
Overall, the takeaway from this section is that as the price increases, supply increases. And as the price decreases, supply decreases.

Credit Slimstock
Demand
Demand is the amount of a product/service that consumers, businesses, governments, etc., are willing to buy in a marketplace.
This is also a complicated definition, so I’ll try to break it down in a simple example.
Say, for instance, you live in a tiny town of 100 people and you run the only snow cone shack in the town. In this scenario, you would be the only supplier in the market, meaning you were able to determine exactly how much you wanted to produce and at what time and where. In addition, the people in the town would be your customers, determining day-to-day demand for your products. If they bought your product, they would be “demanding” it.
But, how do you know what the demand for a product/service is?
Well, you would want to figure out the product’s demand curve, an example shown below:
Again, it looks a little more complicated than it is due to the mixing up of the axes. Simply put, as the price of the product in the market decreases, the amount or quantity you want to buy increases.
Again, let’s make it a little more complicated. Say, for instance, that you’ve just walked into a pizza franchise in a large metropolitan city. How does your demand for their product work?
Your demand depends on the price. What happens if there are multiple people that just walked into this pizza franchise?
Well, it works in the same way. In a market where there is more than 1 consumer of a product/service, each consumer has their own demand curve. The couple that just ordered has one, you, the woman across the street walking her dog has one, etc.
If you combine all of these curves, you create a market-wide demand curve, an example of which is shown below:
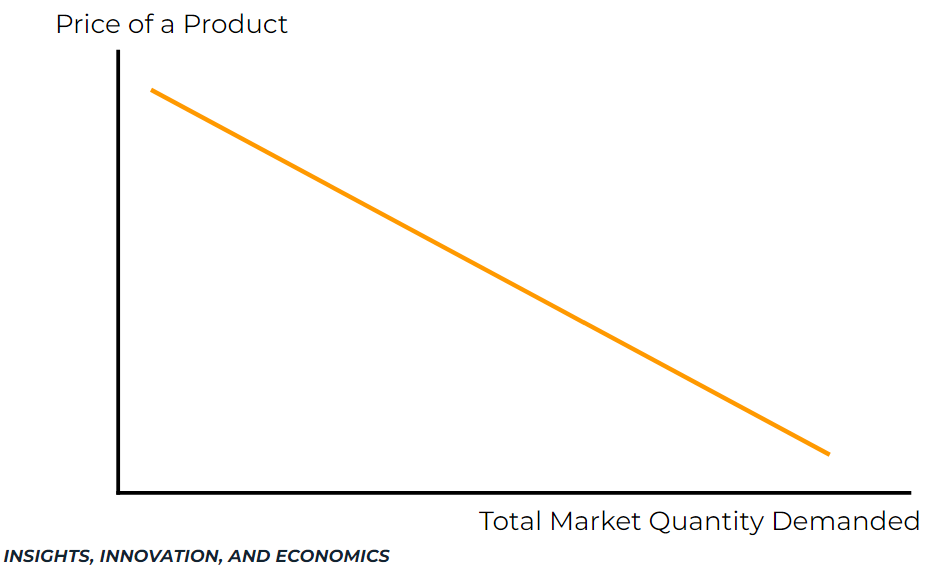
Again, the only material difference between the two graphs is that in the individual demand curve, the x-axis is the quantity that 1 individual demands. In the market demand curve, the x-axis is the total market demand by all of the consumers in the market. In both scenarios, the price (on the y-axis) is the same.
So, back to our scenario, the guy walking in the door for instance wants to buy 2 pizzas at the current price, which is ideal according to his individual demand curve (where the price in the market meets his demand), as shown below:
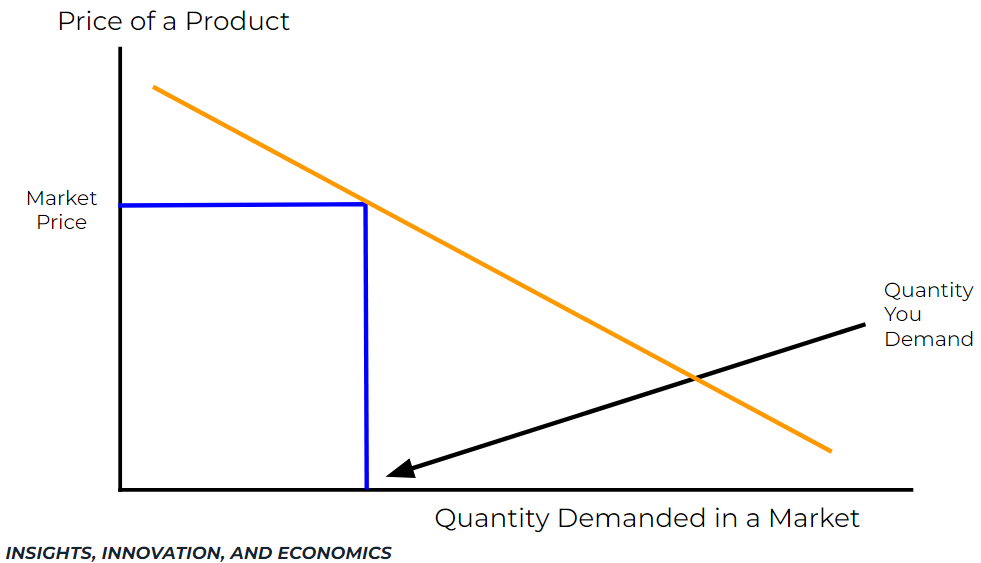
So, he buys 2 pizzas, the people after him buy 5 pizzas, and the couple that just checked out bought 1 pizza, meaning the total market demand is 8 pizzas.
Let’s make it a little more complicated.
A market demand curve is only a snapshot in time, only truly showing what quantity is being demanded in that market at that time and at that price. The rest of the curve shows a “best guess” of what would happen if the price increased or decreased.
That’s complicated, so I’ll just rephrase it this way. There are many factors that affect the quantity in a market, meaning that they affect either the price in the market or the quantity demanded in the market.

Credit iStock
Factors Affecting Demand
1. Price of the Product: This is the easy one. As the price of the product increases, the demand for the good decreases. As the price of the product decreases, the demand for the good increases. Demand and price have an inverse relationship.
2. Price of Substitutes: Substitutes are other goods that consumers could purchase instead of the good in question. For example, a substitute good for Cheerios could be Lucky Charms (or another type of cereal). Where it gets even more complicated is that substitutes don’t always have to be different versions of the same product (cereal for cereal), it could be even more vague, for instance, the substitute for Cheerios could be eggs (or any other breakfast food). Or, it could be even more vague, for instance, the substitute for Cheerios could be pizza (or any other type of food). So, if you’re trying to estimate the demand for Cheerios, substitutes could be as broad as any other type of food.
Back to what we’re talking about. If the price of the substitutes decreases, consumers are more likely to switch to those goods as they don’t care between the two, meaning they are only determining their decision based solely on price. Conversely, if the price of substitute goods increases, consumers are more likely to switch away from those goods to your product, meaning demand would increase.
3. Price of Complementary Goods: Complementary goods are goods that are usually purchased together. For instance, peanut butter and jelly. Many people who buy peanut butter also buy jelly at the same time. So, if the price of peanut butter increases, the demand for peanut butter decreases. But, if the demand for peanut butter decreases, it also can decrease the demand for jelly.
4. Income: If the income of consumers increases, the more likely people are to buy products/services. Yet, this comes with some interesting economic language, such as normal and inferior goods. Normal goods are those in which the demand increases as income levels increase (e.g. high-end cars or name-brand items). Inferior goods are those in which the demand decreases as income levels increase (e.g. ramen or low-priced ice cream). So, if the income of consumers increases, the demand for some products will increase, but the demand for other products will decrease.
5. Tastes and Preferences: Consumers’ tastes and preferences greatly influence demand for products. For instance, if Stanley water bottles become a preference of consumers (through a social fad), then demand for Stanley water bottles increases. Then, when the Stanley water bottle craze dies out, the demand for Stanley water bottles decreases. Just like that, tastes and preferences influence demand for everyday products and services.
6. Expectations of Future Prices: If consumers expect future prices to increase, they may be more likely to buy more of the product today, increasing demand (and subsequently bumping up the price–doing exactly what they feared). If consumers expect future prices to decrease, they may be more likely to wait to buy until the price drops, decreasing demand for the product.
7. Expectations of Future Supply: Similar to the above, if consumers expect future supply to be lower, they may be more likely to buy more today (in fear of failing to get the product in the future). A good example of this would have been the panic at the beginning of the pandemic. As consumers started to buy more and more in preparation for the lockdown, other consumers saw they might not get future supplies. As a result, these consumers decided to buy large amounts today instead of waiting for the future.
8. Expectations of Future Income: If consumers expect their future income to increase, they may be more likely to buy things on credit now with the intent to pay them off later (e.g. cars, houses, cellphones, etc.). Conversely, if consumers expect their future income to decrease, they may be more likely to stop buying things they won’t be able to afford in the future.
9. Increases in Population: This factor affects longer-term demand structure. If the population increases, the overall demand for products will increase (simply because there will be more people). Conversely, if the population decreases, the overall demand for products will decrease.
10. Number of Consumers in a Market: If the number of consumers in a market increases, the overall demand for products increases. For instance, take the number of people moving into or out of certain areas. This mass moving increases the demand for houses in some areas and decreases the demand for houses in other areas.
____
Overall, the takeaway from this section is that as the price increases, demand decreases. And as the price decreases, demand increases.

Credit Adobe Stock
Supply and Demand
Okay, now we know what supply and demand are separately, but how do they work together to form the backbone of our capitalist economy?
Supply and demand work together to determine the price in the market. Market price is determined where the market supply line crosses the market demand line. See the graph below for an example:
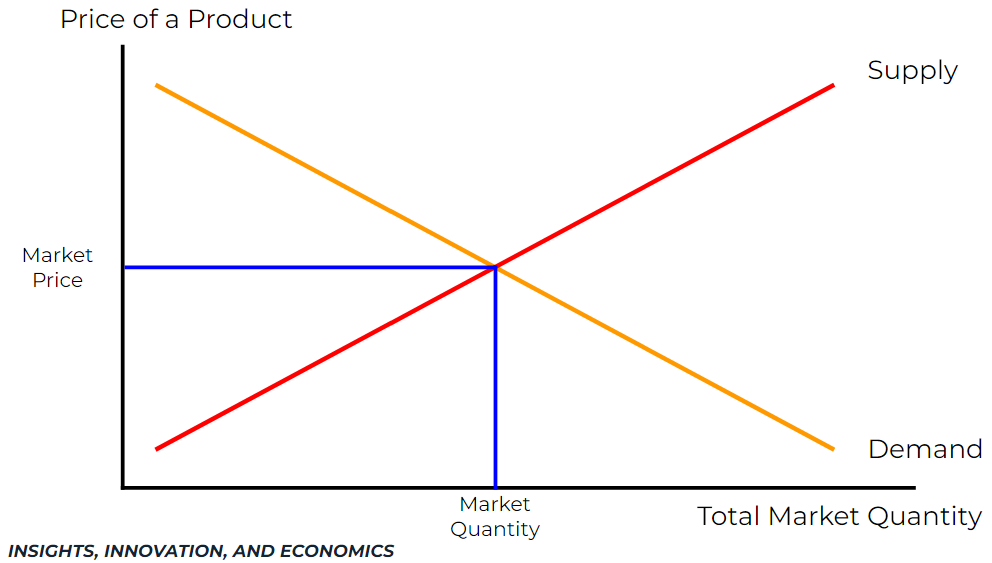
I love a complicated graph, but if you don’t understand it, it means nothing, so let me explain. The red line is our supply line - designating the quantities supplied in a market at a given price in the market. The orange line is our demand line - designating the quantities consumers demand at a given price in the market.
Where they intersect determines the market price and the market quantity (how much suppliers supply and how much consumers demand). This is called the point of equilibrium.
Yet, the demand and supply lines only intersect once. Why aren’t the lines the same? Well, let’s consider it. When the price is low, people want to buy a bunch of the product (demand is high), but suppliers don’t want to supply a bunch of the product (supply is low–they make low amounts of money). Producers in this market won’t be compensated enough for their products, so they have no incentive to produce more to meet demand. So, they produce less, artificially driving up the price.
What does it mean to artificially drive up the price? Well, if the producer only produces 10 units of a product, and the consumers demand 50 units, then the market basically becomes an auction. In an auction, the consumers with the highest willingness to pay will buy the good (meaning the person who will pay the highest price will get the good). See how this scarcity artificially increases the price?
Okay, hope this makes sense. Let’s make it more complicated by adding in the factors that affect supply and demand.
Let’s consider factors affecting supply first. When a factor affects supply, the supply can increase or decrease. How does this affect our graphs? The supply line shifts left or right. If supply decreases, the supply line shifts left. If supply increases, the supply line shifts right. Here are some graphs that show what’s specifically happening:
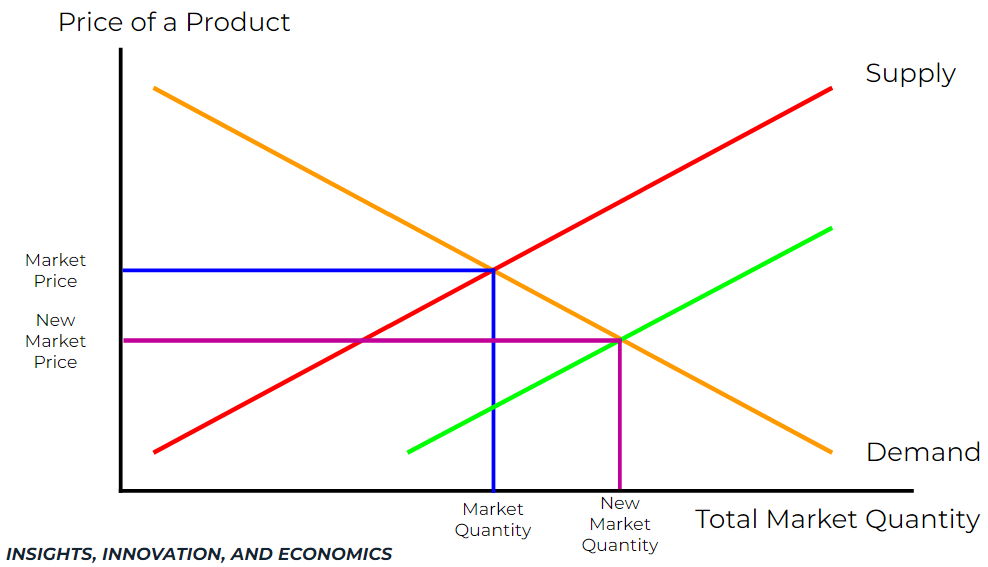
Here is a graph showing supply increasing (supply shifts to the right). The new supply is denoted by the green line and the purple lines denote the new market quantity and price.
Note how this change in supply affects the quantity and price in the market. As supply increases, price decreases (because the suppliers need to incentivize more people to buy their products that weren’t already, so they lower the price). When the price decreases, demand increases.
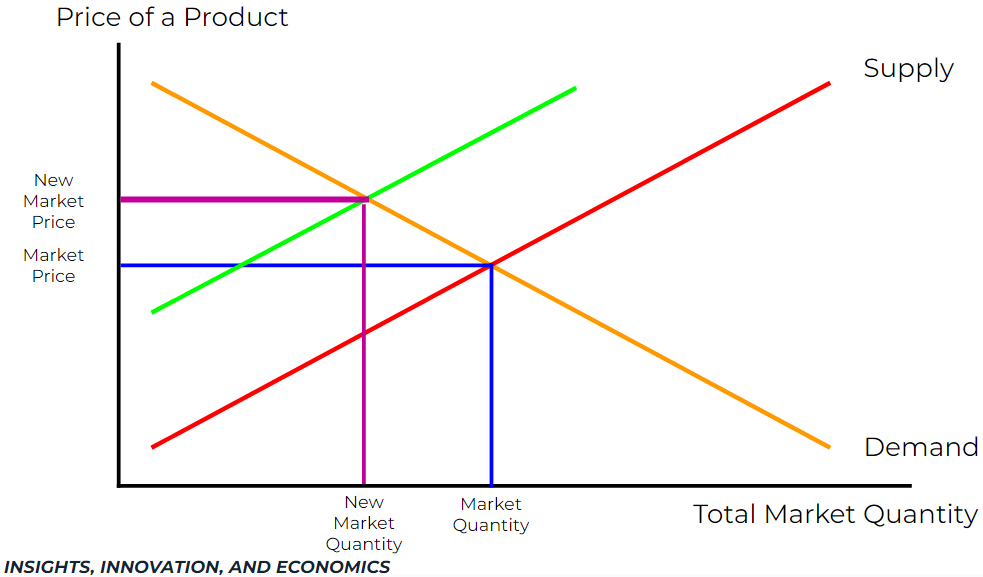
Here is a graph showing supply decreasing (supply shifts to the left). The new supply is denoted by the green line and the purple lines denote the new market quantity and price.
Note how this change in supply affects the quantity and price in the market. As supply decreases, price increases (because there is less quantity, it becomes an auction where the highest bidders win the product). When the price increases, demand decreases.
As you can see, shifts in the supply can increase and decrease the price in a market. Shifts in the supply curve can also increase and decrease the quantity in a market.
Now, let’s see what happens with demand.
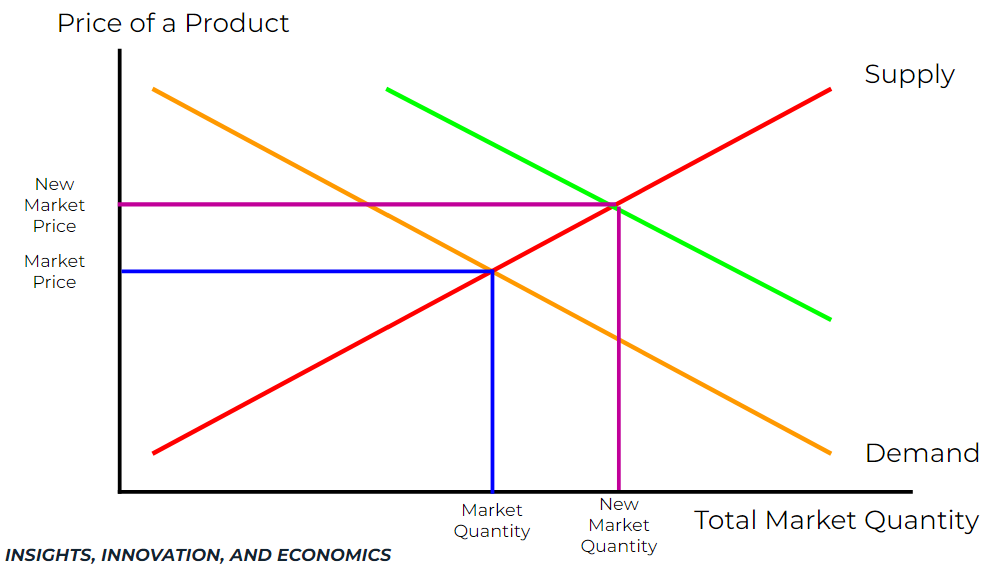
Here is a graph showing demand increasing (demand shifts to the right). The new demand is denoted by the green line and the purple lines denote the new market quantity and price.
Note how this change in demand affects the quantity and price in the market. As demand increases, price increases (because there is more demand, more people want the good, meaning more people will be willing to pay a higher price to get the good). When the price increases, the supply of the good increases as suppliers want to capitalize on this higher price.
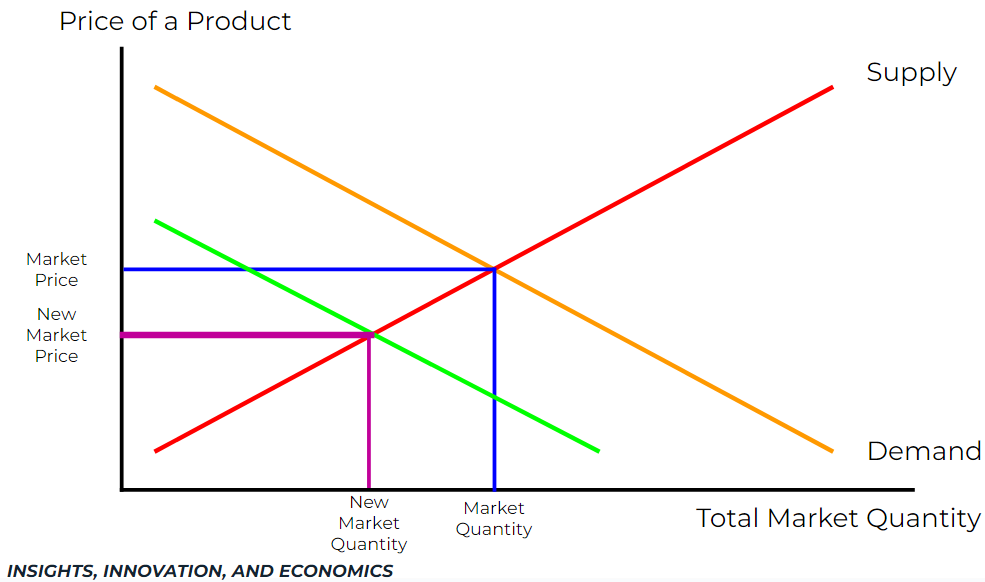
Here is a graph showing demand decreasing (demand shifts to the left). The new demand is denoted by the green line and the purple lines denote the new market quantity and price.
Note how this change in demand affects the quantity and price in the market. As demand decreases, the price decreases (because fewer people want the good, meaning suppliers have to lower their prices to incentivize people to purchase). When the price decreases, the supply of the product decreases.
As you can see, shifts in demand can increase and decrease the price in a market. Shifts in the demand curve can also increase and decrease the quantity in a market.
____
Supply and demand are complex factors that underlie our entire economy. Everything bought and sold is done so through supply and demand.
Credit iStock
But, why should you care?
Supply and demand determine the price in a market. Understanding the factors that affect supply and demand will help you understand how the price will change in the future–whether that price will increase, decrease, or stay the same. By having this information, you can be a more educated consumer, better planning your purchasing decisions.
These factors are especially important if you’re planning to run a business. For instance, if you are an owner of a pizza restaurant. Suddenly there is a global pandemic and people are staying inside. What will happen to your business? Well, demand will significantly decrease. This means you should significantly decrease your supply (no use having pizza ingredients if no one wants pizzas). So, the overall quantity in the market decreases. But what happens to the price in the market? Price significantly decreases as the suppliers need to incentivize more people to purchase their pizzas, so they offer them at a discount.
These factors are also important if you’re planning to be an employee in a business. Employees need to make supply and demand decisions all the time. Supply and demand factors also determine the success of the business you work for. Consider our example above with the pizza shop. If you work for a pizza shop and demand significantly decreases, this means the company will be selling fewer pizzas.
What does this mean for you? Well, the pizza place has costs they need to meet. So if the demand decreases and the price decreases, the profit per pizza becomes less (as it’s still costing them the same amount to make a pizza but they aren’t making as much profit since the costs are low - remember profit for an individual good = price minus costs). So, the pizza place now struggles to cover its costs with the profit it is making.
Again, what does this mean for you? Well, the pizza place wants to make a profit and they’re making a smaller amount of pizzas, so they don’t need all of their workers that they did for maximum production. So, they start laying off employees.
Just like that, through the simple concepts of supply and demand, we can explain why there were mass layoffs in the services industry when the COVID-19 pandemic began.
So, why should you care?
Understanding supply and demand and their determinants helps businesses, consumers, employees, and policymakers to make more informed decisions.
Ultimately, supply and demand provide crucial insights into how markets function, how resources are allocated, and how various economic agents make decisions.
Anywho, that’s all for today.
-Drew Jackson
Disclaimer:
The views expressed in this blog are my own and do not represent the views of any companies I currently work for or have previously worked for. This blog does not contain financial advice - it is for informational and educational purposes only. Investing contains risks and readers should conduct their own due diligence and/or consult a financial advisor before making any investment decisions. This blog has not been sponsored or endorsed by any companies mentioned.


 brainwaves.me@gmail.com